This page shows a small number of the DORA functionalities.
It starts when logging in. Users must login with 2FA.
Before an analysis is started, Master Data must be entered.
Data which can be used in more analyses, should be entered / imported once.
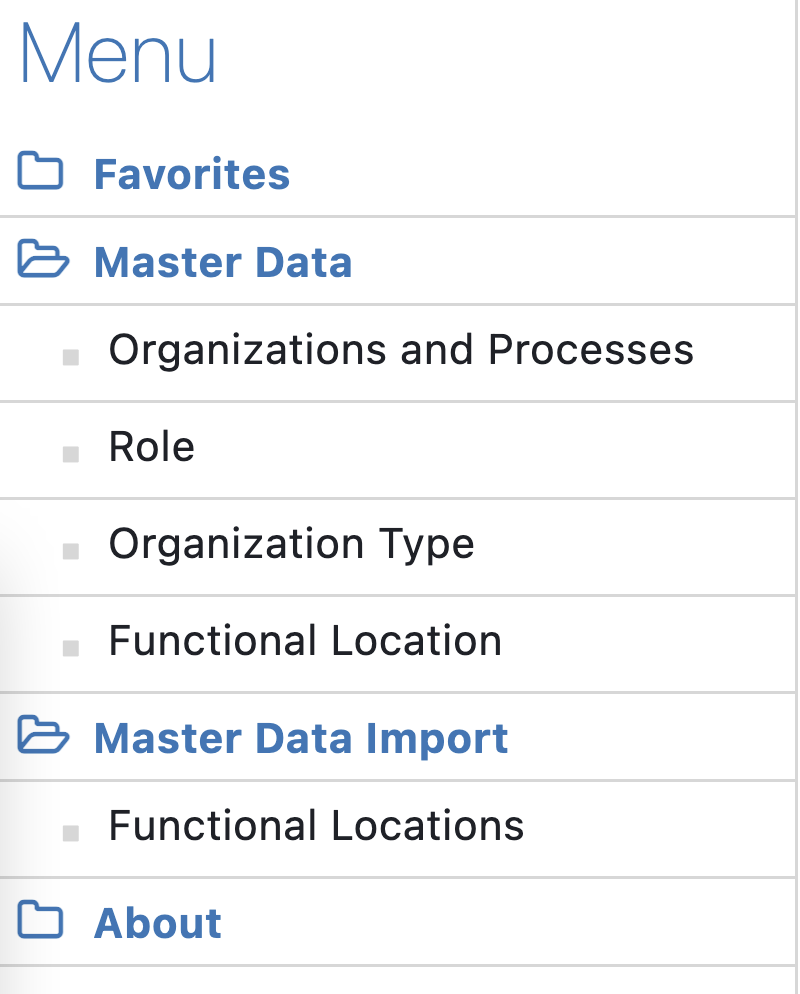
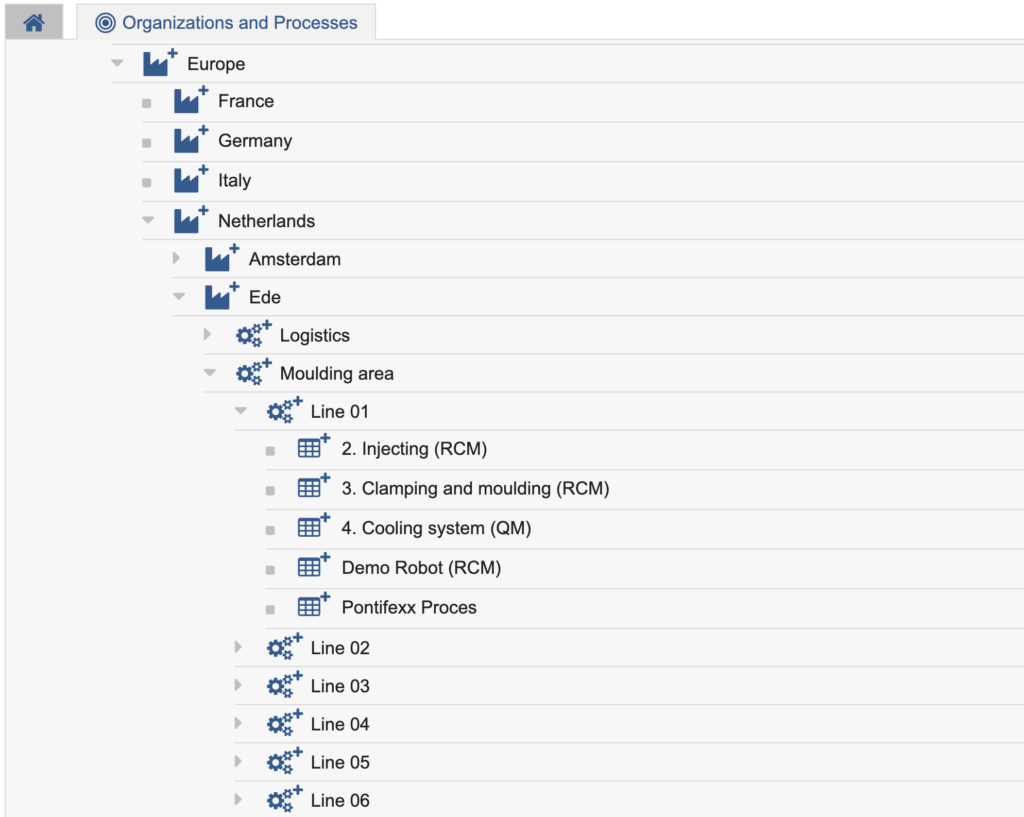
In Organizations and Processes, the layout of the factory with all organizations, departments, analyses are shown. In DORA your own system can be created.
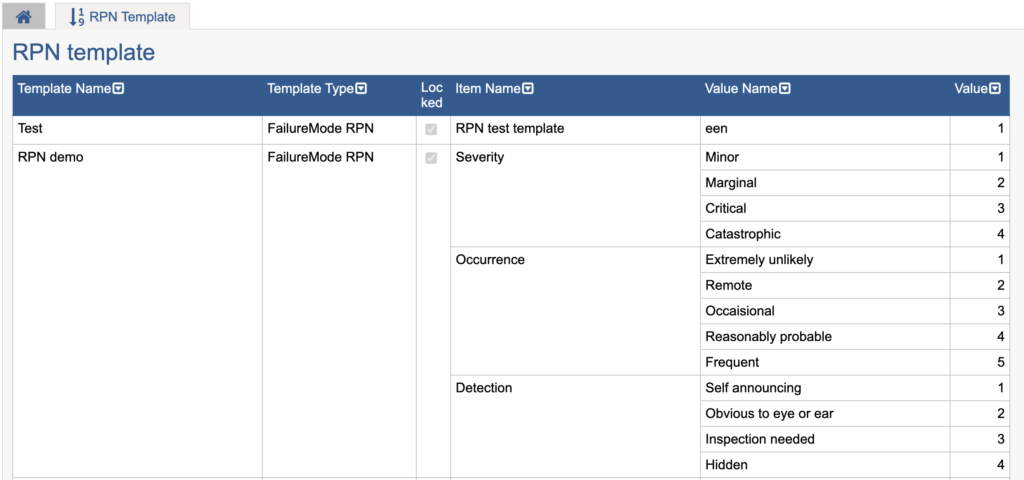
RPN (Risk Priority Numbering) is used to use FMECA and evaluate failure modes. Standard templates are available, you just add your own template.
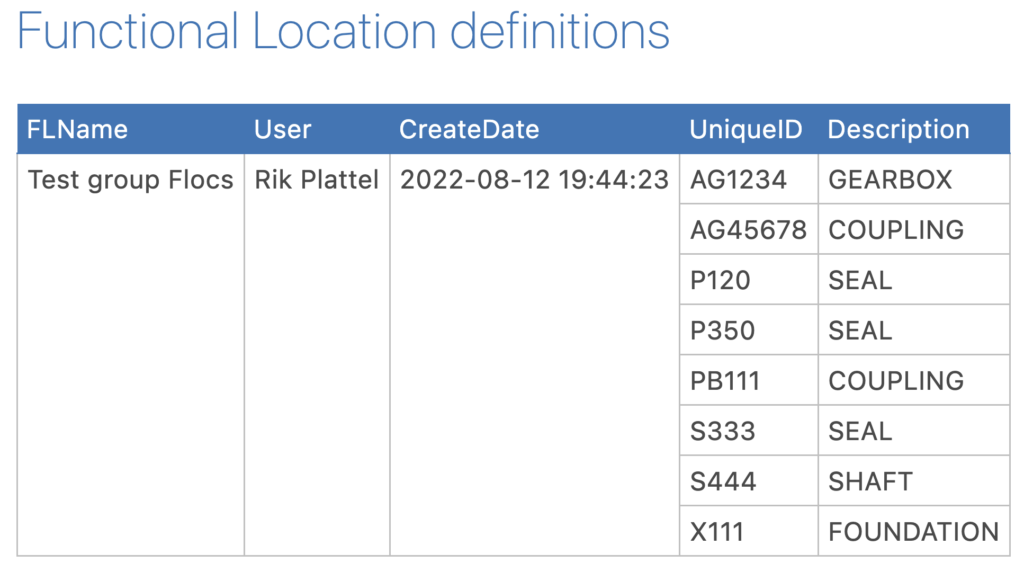
Import functional locations to connect each failure mode and each task / interval to your own Floc (functional location)
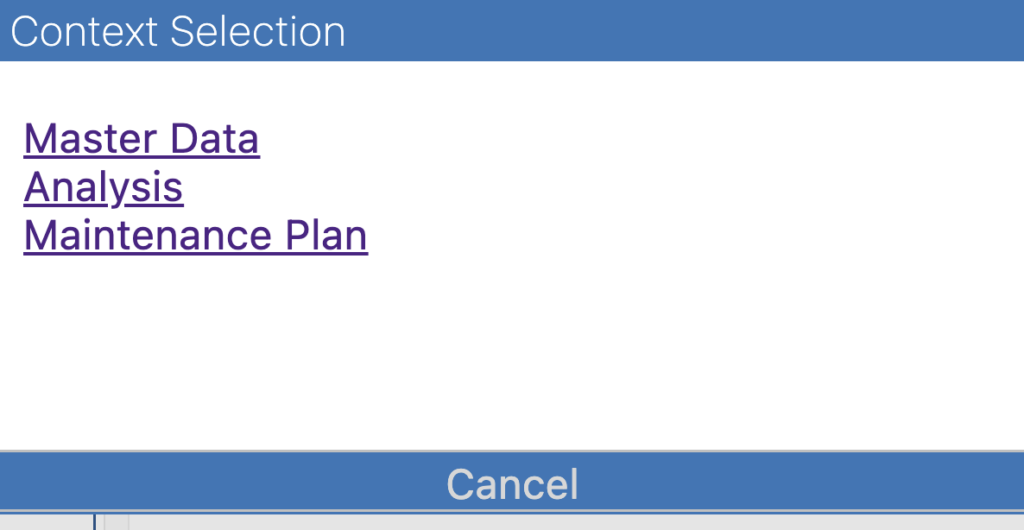
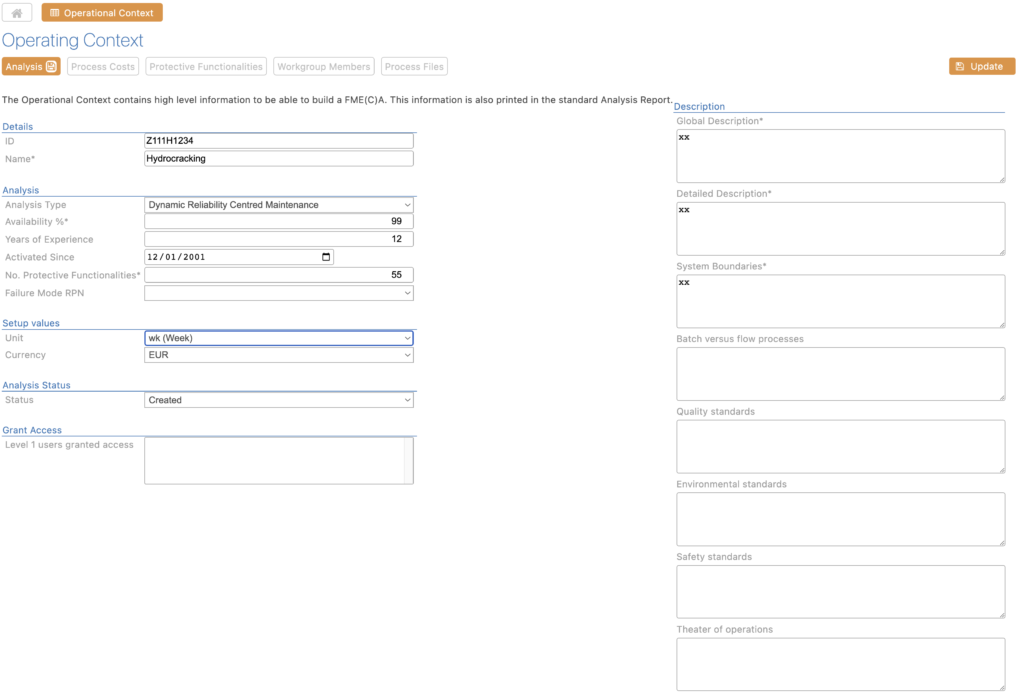
When Master data has the most important information available, select the context: ANALYSIS to start the analysis.
Each analysis is built on a Operating Context. It not only describes what it is, but also where and how it is used and what it is expected to do. The OC has 5 pages:
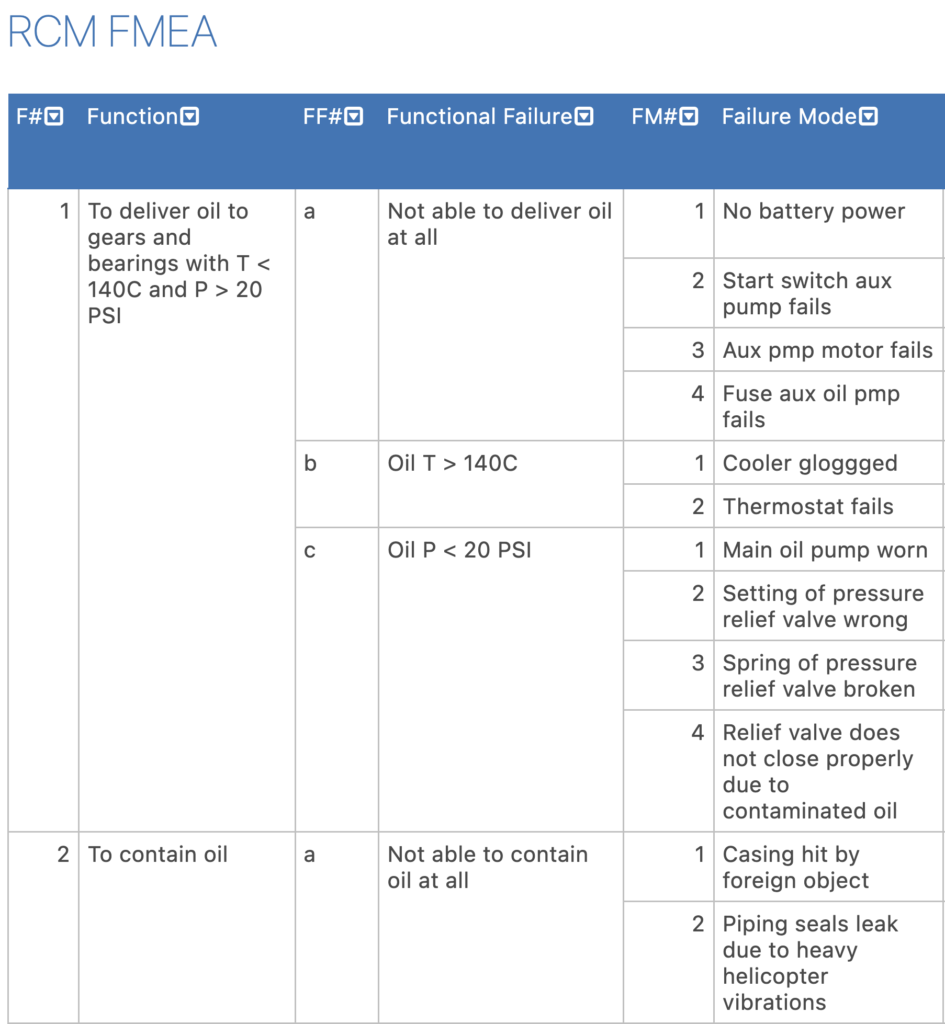
The RCM FMEA shows the standard template for functions, functional failures and failure modes..
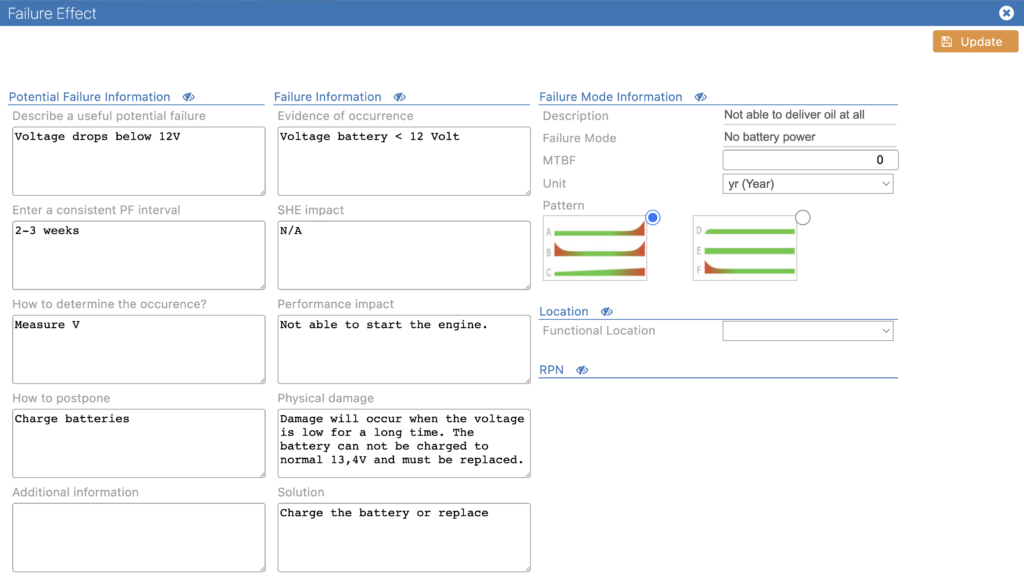
The failure effect is a separate screen, because it shows what happens when a failure mode occurs. It shows potential failures which develop before the failure mode occurs and functional failure information, from the moment the failure mode occurred.. Failure pattern group, etc, can be entered.
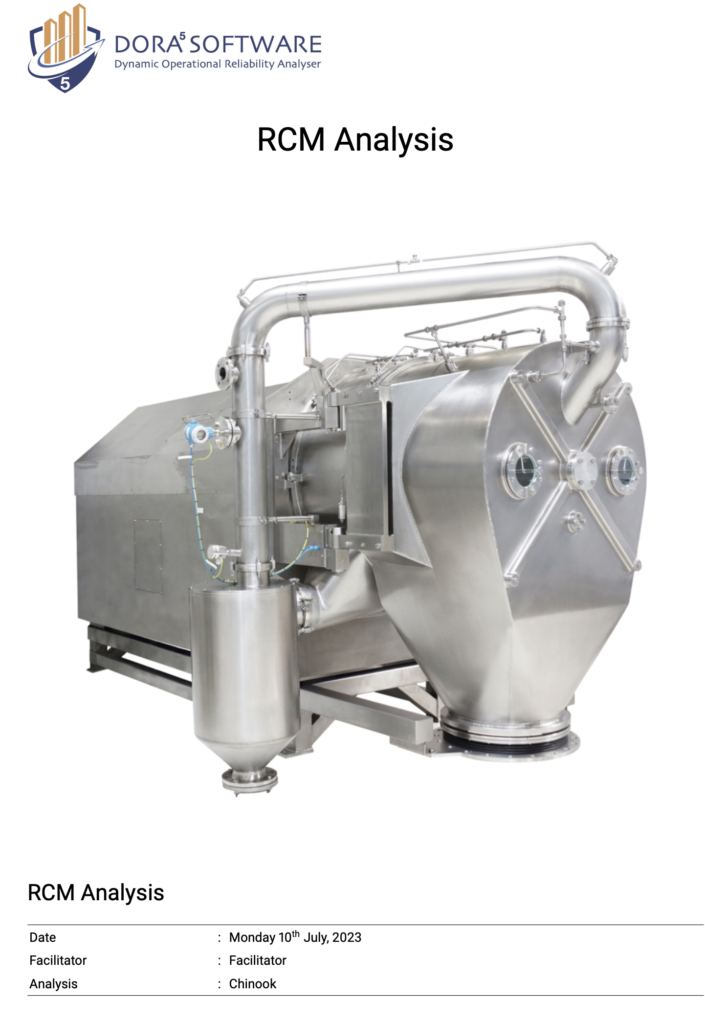
A standard RCM report can be downloaded and all available information is shown in the PDF.
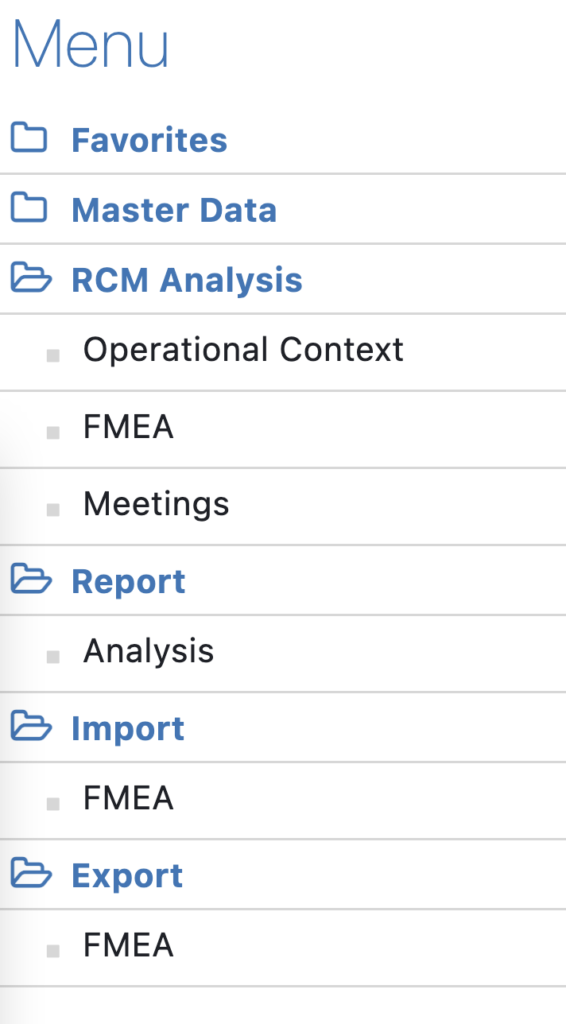
The RCM menu shows a simple overview of functionalities.
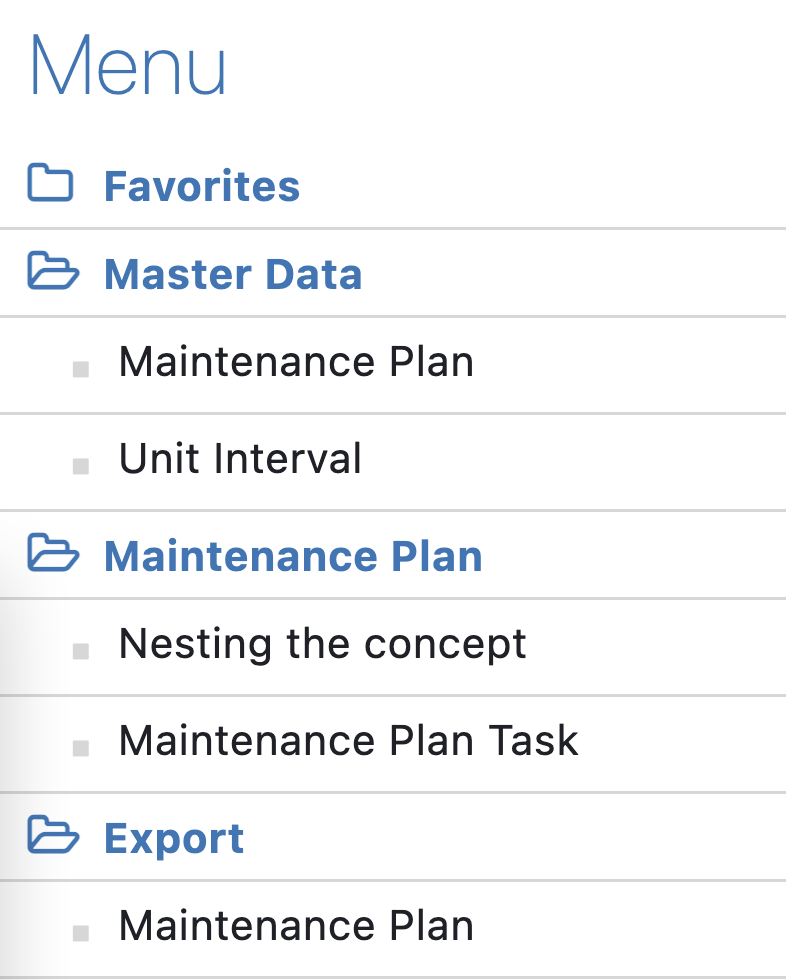
Once the maintenance concept is finished, all failure modes are connected to a maintenance task and interval. Some tasks are overlapping each other and some intervals are close to each other. This means QM and RCM maintenance concepts must be optimized. This is called NESTING. It is not a part of QM or RCM, but a standard DORA functionality. Any maintenance concept must be nested to become a maintenance plan with less tasks and still cover the full failure behavior from the FMEA’s. During nesting, DORA takes care that maximum intervals from hidden, HSE and economic consequences are optimized the way the should be. Mistakes like increasing tasks intervals for HSE or Hidden are prevented by DORA. We open MAINTENANCE PLAN.

Quick Maintenance (QM) is using the RCM thought ware, but all time consuming steps are minimized. This means QM is less detailed, less thorough than RCM and should never be used for high critical systems. But it is great to analyze low – medium critical systems. One maintenance / reliability engineer is able to do a QM analysis for low critical systems. For medium critical systems, a RCM facilitator with a RCM workgroup uses QM. So more knowledge and experience is available, because it is medium critical. The result of QM is also a maintenance concept.
QM uses the RCM terminology. Failure modes and failure effects are added in the same way as in RCM.
Two approaches are used in QM:
The QM FMEA is different from the RCM FMEA. QM uses an Object FMEA and RCM a Process FMEA.
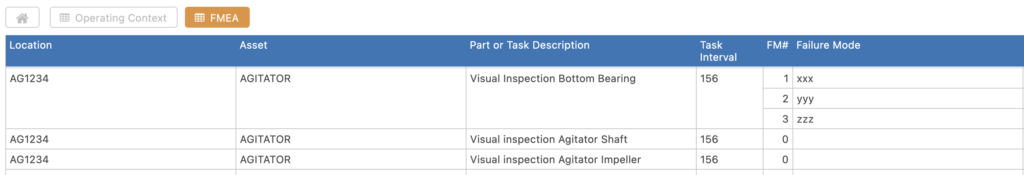
For each asset / part or for a task and interval, failure modes are listed in the FMEA. The failure effect is done in the same way as in RCM. So, when RCM knowledge is understood, QM can be explained in 15 minutes.
The QM decision digram also uses RCM thought ware, but highly streamlined. The FMEA is shown and the user must select if the failure mode is hidden and has a negative effect on HSE. This influences the available task options which are shown.
When all failure mode / failure effect combinations, are connected to a maintenance concept task, the maintenance concept is finished.
QM and or RCM maintenance concepts which are finished, are shown and can be selected to nest to a maintenance plan. Taks can be selected to combine and DORA takes care mistakes are made. When finished with the nesting, the maintenance plan can be exported, so the maintenance program in the CMMS can be upgraded.
Single User, Multi User, Enterprise? Demo, offer or buy directly? Contact us.
You can start with the Single User package within 1 day.
You can order a Single User package online here.